In the fast-paced world of finance, traders and investors look for ways to stay ahead. Trading chart analysis is a key tool for predicting price movements in different assets. It uses technical analysis to study price patterns and trends, helping find good trading opportunities.
This method is different from fundamental analysis, which looks at economic factors and company finances. Trading chart analysis focuses on price movements to find ways to make money over time. By understanding price charts, traders can spot trends, find support and resistance levels, and make smart choices in the financial world.
Key Takeaways
- Trading chart analysis is a core component of technical analysis, focusing on price patterns and market trends.
- It differs from fundamental analysis by concentrating on price action rather than economic factors.
- Traders can learn technical analysis through various resources, but should be cautious of unrealistic promises.
- Understanding price chart behavior and market psychology can provide valuable insights for trading decisions.
- Effective trading chart analysis requires a combination of technical knowledge, risk management, and disciplined execution.
Understanding the Basics of Trading Charts
Trading charts are key tools for analyzing financial markets. They show price movements over time. This helps traders spot trends, patterns, and opportunities.
What are Trading Charts?
Trading charts are graphs that show a financial instrument’s price history. This includes stocks, currencies, or commodities. They help traders understand market behavior and make better trading choices.
Types of Trading Charts
- Line Charts: These simple charts show a financial instrument’s closing prices over time, forming a line.
- Bar Charts: Bar charts show open, high, low, and close prices for a time period. They offer more detail than line charts.
- Candlestick Charts: Candlestick charts are loved by traders. They clearly show open, high, low, and close prices.
Key Components of Trading Charts
Trading charts have several important parts:
- Price Bars or Candlesticks: These show price movements. They tell us about open, high, low, and close prices for a time.
- Time Axis: The horizontal axis shows the data timeline, like days, weeks, or months.
- Price Axis: The vertical axis displays the price scale for the traded financial instrument.
- Volume Indicators: These show trading volume. They help analyze market activity and confirm price trends.
Learning about trading charts opens up the world of technical analysis. It helps traders make smarter decisions in the financial markets. Next, we’ll explore candlestick patterns, chart indicators, and why technical analysis is crucial.
The Importance of Technical Analysis
Technical analysis is key for traders. It helps predict future price movements using past market data. This method believes all important info is in the price, helping traders spot good times to buy or sell. It also lets them understand market mood and make smart choices.
How Technical Analysis Helps Traders
Technical analysis looks at price trends and patterns. It gives traders useful insights for making decisions. This way, traders can:
- See where the market is going and how strong it is
- Find key support and resistance points
- Spot when prices are too high or too low
- Find out when big changes might happen
- Time their trades better
Advantages Over Fundamental Analysis
Some traders only use technical analysis, while others mix it with fundamental analysis. Technical analysis has some big benefits:
- It focuses on price trends and patterns, not just economic data
- It’s great for finding quick trading chances
- It works for all kinds of trading time frames
- It looks at market psychology and what investors think
Understanding technical analysis and its part in market trends helps traders. They can use a more complete strategy in the financial markets.
“Technical analysis is the use of historical market data to predict future price movements.”
Candlestick Charts Explained
Candlestick charts are a key tool in technical analysis. They show a lot of information in one price bar. Each bar represents a time period and shows the opening, closing, high, and low prices.
The body of the candlestick shows the range between opening and closing prices. The wicks or shadows above and below the body indicate the high and low prices.
Structure of a Candlestick
The structure of a candlestick chart is designed to show important market information. The body of the candlestick shows the difference between the opening and closing prices. A green or white body means a higher closing price, while a red or black body means a lower closing price.
The wicks or shadows above and below the body show the highest and lowest prices reached during that time period.
Types of Candlestick Patterns
- Doji Patterns: These candlesticks indicate market indecision and potential trend changes. Variations like dragonfly and gravestone doji offer specific insights into market sentiment.
- Bullish Patterns: Patterns like the hammer and engulfing pattern can signal potential buying pressure and trend reversals.
- Bearish Patterns: Bearish patterns such as the hanging man and evening star can suggest selling pressure and potential trend changes.
“Candlestick charts are a standard feature on virtually every trading platform provided by online stock brokers.”
Understanding different candlestick patterns helps traders. It gives them insights into the market’s psychology. This way, they can make better trading decisions based on price action.
Interpreting Trading Volume
In the world of technical analysis, trading volume is key. It shows how many shares or contracts are traded in a set time. This gives us clues about the strength and belief behind market changes.
What is Trading Volume?
Trading volume is the total shares or contracts traded in a certain time, like a day or month. High volume means strong interest in the market. It can confirm big price changes. Low volume might show traders are unsure or not convinced.
Volume Indicators in Chart Analysis
- On-Balance Volume (OBV): This indicator adds volume on up days and subtracts it on down days. It shows the demand or supply in the market.
- Volume Weighted Average Price (VWAP): VWAP finds the average price of a security, weighted by volume. It helps understand the value of a stock’s price change.
By looking at volume and price, traders can understand market activity better. High volume shows a strong trend. Low volume might mean a change or pause in the trend.
“The price moves the headlines, but it’s the volume that tells the story.”
Knowing and understanding trading volume is vital in technical analysis. It helps traders see the belief and momentum behind market movements.
Trend Analysis: Spotting Market Movement
In trading, trend analysis is key to success. It helps traders understand the market’s direction. This way, they can make smart choices and grab new chances. Trend analysis looks at three time frames: short, intermediate, and long-term.
Identifying Uptrends and Downtrends
Uptrends show higher highs and higher lows, meaning the market is bullish. Downtrends have lower highs and lower lows, showing a bearish market. Spotting these patterns is vital for good trading plans.
Using Trendlines Effectively
Trendlines are great for seeing and confirming trends. Traders draw them by linking important highs or lows on charts. Upward trendlines act as support in good markets, while downward trendlines are resistance in bad ones. Trendlines help traders find when to buy or sell and spot trend changes.
But, trend analysis has its downsides. Some say markets are efficient, making trend analysis less useful. Others point out that the future isn’t set by past trends. Still, trend analysis is a useful tool for traders wanting to grasp market dynamics and make smart investment choices.
“The trend is your friend, until the end when it bends.” – Ed Seykota
Trend analysis offers insights into market psychology and momentum. It helps traders spot risks or warning signs of downturns. By mixing trend analysis with other methods, traders can make better decisions and boost their trading success.
Chart Patterns Every Trader Should Know
Chart patterns are key in technical analysis. They help traders see where prices might go next. Knowing these patterns can make trading more profitable.
Common Bullish Patterns
The ascending triangle, cup and handle, and double bottom are common bullish patterns. The ascending triangle shows a pause before a price jump. The cup and handle pattern shows a return to good times after a bad spell. The double bottom pattern means a price drop is over and things are looking up.
Common Bearish Patterns
Traders should know about bearish patterns too. These include the head and shoulders, descending triangle, and double top. The head and shoulders pattern warns of a shift from good to bad times. The descending triangle shows a price drop. The double top pattern means a price peak is followed by a drop and then another climb.
Knowing both bullish and bearish patterns helps traders a lot. They can use these patterns with other tools and a good risk plan. This way, they can make better trading choices and handle market ups and downs.
“Mastering chart pattern recognition is a crucial step in becoming a proficient trader. These visual cues can offer invaluable insights into market sentiment and potential price movements.”
Support and Resistance Levels
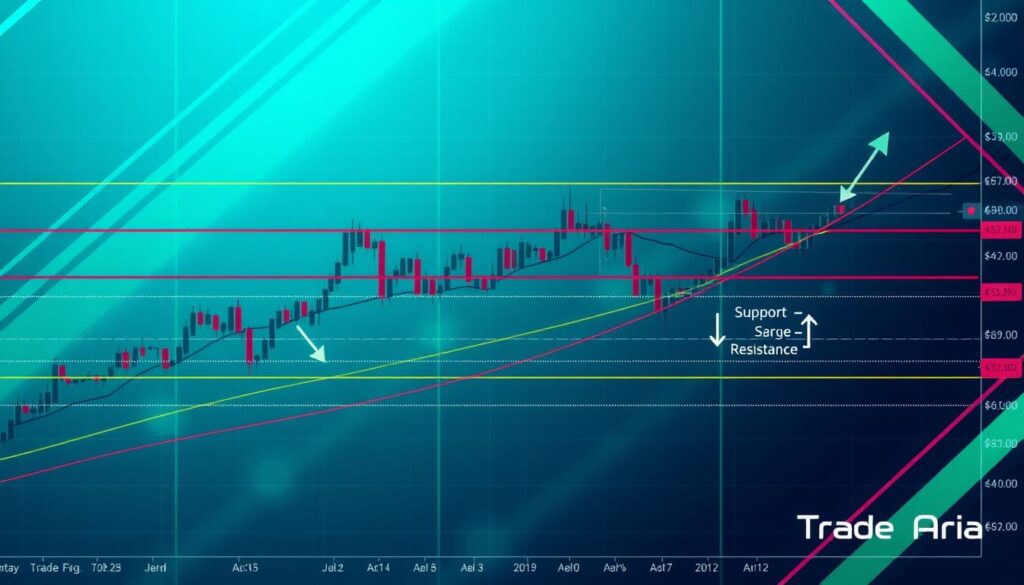
Support and resistance levels are important in technical analysis. They show where a security might stop and change direction. Support levels are where buyers can push prices up, while resistance levels are where sellers can push prices down.
Traders use these levels to find good times to buy or sell. They also set stop-loss orders and look for big price moves.
What are Support and Resistance?
Support and resistance levels are key in financial markets. They show where supply and demand meet. Support is where demand keeps prices from falling, and resistance is where selling stops prices from rising.
A drop below support means sellers are winning, and a rise above resistance means buyers are winning. This helps traders understand market trends.
How to Identify These Levels
- Charts use trendlines and moving averages to find support and resistance.
- Previous highs and lows help identify these levels.
- Many market players react to the same information at these levels.
- It’s important to be flexible when using support and resistance levels.
Technical analysts look at support and resistance to spot where trends might change. These levels are key to understanding price action and making smart trading choices.
“Support and resistance levels are pivotal points in financial markets where supply and demand intersect.”
Popular Technical Indicators
In trading, technical indicators are key for spotting trends and opportunities. Moving averages and the Relative Strength Index (RSI) are favorites among traders.
Moving Averages Explained
Moving averages smooth out price data to show trend directions. Simple moving averages (SMA) and exponential moving averages (EMA) are common. Traders watch for crossovers to signal trade entries or exits.
RSI and Its Application
The Relative Strength Index (RSI) tracks price movement speed and changes. It ranges from 0 to 100. Over 70 is overbought, under 30 is oversold. Traders use it to spot these conditions and make trading decisions.
Tools like moving averages and RSI help traders understand markets better. Knowing how to use them can lead to smarter trading choices.
“The combination of technical indicators can provide a more comprehensive view of the market, helping traders identify potential entry and exit points with greater confidence.”
The Role of Timeframes in Chart Analysis
In trading, the timeframe you choose is key. Each timeframe gives unique insights into market trends. Knowing how to use them is vital for good trading strategies. Timeframes range from 1-minute to monthly charts, each suited for different trading styles.
Different Timeframes for Different Strategies
Short-term traders look at 5-minute, 15-minute, or hourly charts. These allow them to catch quick market changes and day-trading chances. Swing traders might use 4-hour or daily charts for a wider view of trends and setups.
Long-term investors often use weekly or monthly charts. These help them see the big picture and make smart portfolio decisions.
How to Choose the Right Timeframe
- Your trading style, the market, and strategy determine the timeframe choice.
- Start with daily or 4-hour charts if you’re new. They balance insight and noise well.
- Looking at different timeframes together gives a full view of market dynamics. This helps in making better trading choices.
- Stick to a specific timeframe mix. It helps you understand market patterns and trends better.
Timeframes are crucial in chart analysis. By grasping the differences and their roles in your strategies, you can gain deeper market insights. This could lead to better trading results.
“The longer the time frame, the more reliable the signals given, with longer time frames defining primary trends.”
Risk Management in Trading
Effective risk management is key to long-term trading success. As a trader, it’s crucial to know how to manage risk. This includes position sizing and setting stop-loss orders.
Position Sizing for Effective Risk Management
Position sizing means figuring out how much capital to risk on each trade. It’s usually a small part of your total trading account. This method helps keep your capital safe during losing times and boosts gains when you win.
The “1% rule” is a common guideline. It suggests risking no more than 1% of your total account value on a single trade. This rule helps you handle market ups and downs and prevents big losses.
Setting Stop-Loss Orders
Stop-loss orders are vital for managing risk. They automatically close a trade when the price hits a set level. Properly placed stop-loss orders protect you from big losses and let your trades grow.
Traders often set stop-loss points at least 1.5 times the current high-to-low range. This helps avoid unwanted trades. By using stop-loss orders, you can control your losses and aim for bigger gains.
Good risk management also means diversifying, setting realistic profit targets, and keeping a balanced risk-reward ratio. By following these strategies, you can trade with confidence and boost your chances of success.
“Successful traders understand that risk management is just as important as finding profitable trading opportunities.”
The Psychology of Trading
In trading, the psychology of investors plays a big role. Knowing the market sentiment helps predict price changes. Traders must control their emotions, like fear and greed, to make better choices.
Understanding Market Sentiment
Tools like on-balance volume (OBV), accumulation/distribution (A/D), and open interest show market mood. A rising OBV means traders are optimistic. Falling OBV shows they’re pessimistic.
Positive A/D means traders are hopeful, while negative A/D shows doubt. Changes in open interest show who’s more confident.
The Impact of Psychology on Trading Decisions
Traders face many psychological traps. Overconfidence, confirmation bias, and the disposition effect can harm their success. Keeping a journal and sticking to a plan helps overcome these issues.
Understanding trading psychology, market sentiment, and behavioral finance helps traders. It gives them a better view of the market and leads to smarter decisions.
“The stock market is driven more by sentiment than by fundamentals.”
– Peter Lynch, legendary investor
Developing a Trading Strategy
Creating a solid trading strategy is key to success in the financial markets. A good plan includes clear rules for when to enter and exit trades. It also has strong risk management and criteria for finding good trades. Traders mix technical indicators, chart patterns, and fundamental analysis to fit their style and risk level.
Creating Your Own Trading Plan
Creating your own trading plan is a big step towards becoming a skilled trader. Your plan should list your goals, how you’ll manage risk, and the tools you’ll use to spot trades. A structured plan helps you make better, more disciplined trades, which can lead to long-term success.
Importance of Backtesting Strategies
Backtesting is essential for any trading strategy. It tests your ideas against past market data. This helps you see how well your strategy might do and find ways to improve it. Backtesting doesn’t promise future success, but it’s a good way to check if your strategy could work.
FAQ
What is trading chart analysis?
Trading chart analysis helps predict future market prices. It uses behavioral economics and market trends to find trading chances. It focuses on price charts to aim for long-term gains.
What are the different types of trading charts?
There are many types of trading charts. Line charts, bar charts, and candlestick charts are common. Candlestick charts show opening, closing, high, and low prices.
How does technical analysis differ from fundamental analysis?
Technical analysis looks at price and market data. Fundamental analysis looks at economic factors. Technical analysis predicts prices based on past data, while fundamental analysis looks at a security’s true value.
What are the key components of a trading chart?
A trading chart has price bars, a time axis, a price axis, and volume indicators. These help traders spot trends and make decisions.
What is the importance of trading volume in chart analysis?
Trading volume shows how many shares are traded. Volume indicators help confirm trends. High volume means strong market interest.
How can traders identify market trends using trendlines?
Trendlines show market trends by connecting highs or lows. Upward trendlines support bullish markets. Downward trendlines resist bearish markets.
What are some common chart patterns used in technical analysis?
Bullish patterns include ascending triangles and cup and handle. Bearish patterns include head and shoulders and double tops. These signal price movements.
How can traders identify support and resistance levels?
Support and resistance levels are where prices tend to reverse. They can be found using highs and lows, trendlines, and moving averages.
What are the most widely used technical indicators?
Moving averages and the Relative Strength Index (RSI) are key indicators. They help measure price changes and trends.
How do different timeframes affect trading strategies?
Timeframes shape market views and trading decisions. Short-term traders use 5-minute charts. Swing traders prefer 4-hour or daily charts. The right timeframe depends on the trader’s style.
What are the key aspects of effective risk management in trading?
Good risk management includes position sizing and stop-loss orders. It also involves diversification and a balanced risk-reward ratio. This keeps capital safe and maximizes gains.
How does trading psychology impact trading success?
Trading psychology is crucial for success. Traders must manage emotions and avoid biases. Discipline helps overcome common pitfalls.
What are the essential elements of a robust trading strategy?
A solid trading plan has clear rules and risk management. It also outlines how to find trading opportunities. Backtesting is key to refining strategies.


